Gallery#
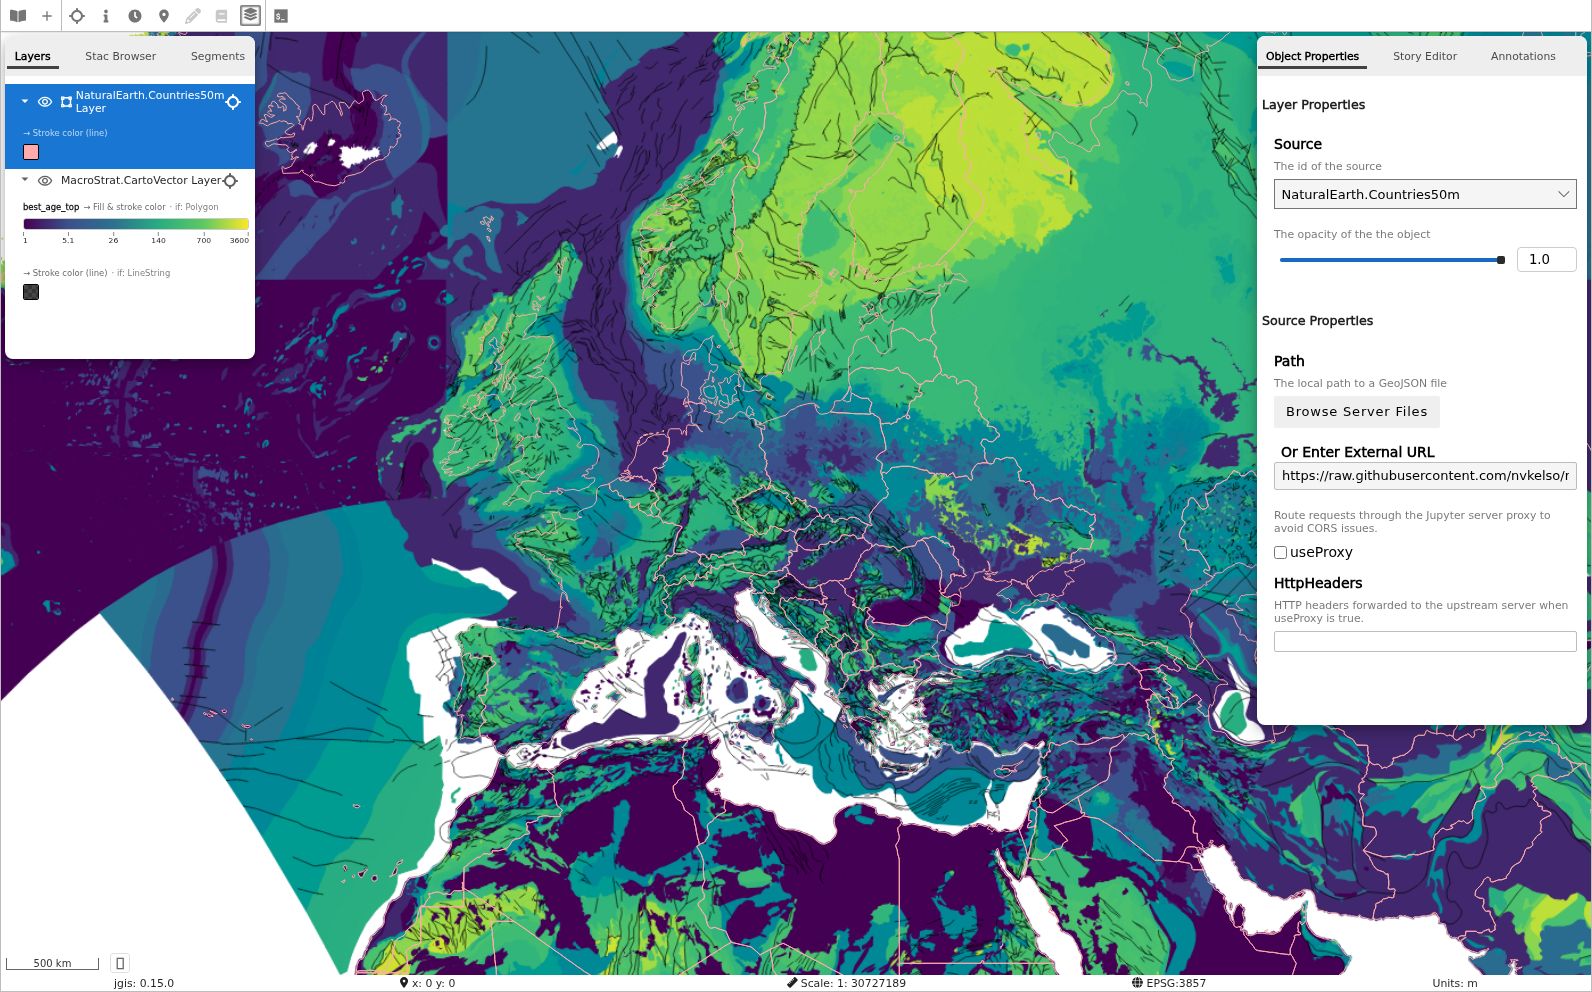
Macrostrat geology overlay — Geological map data from Macrostrat displayed as a vector tile layer in JupyterGIS, with the layer panel and source properties visible.
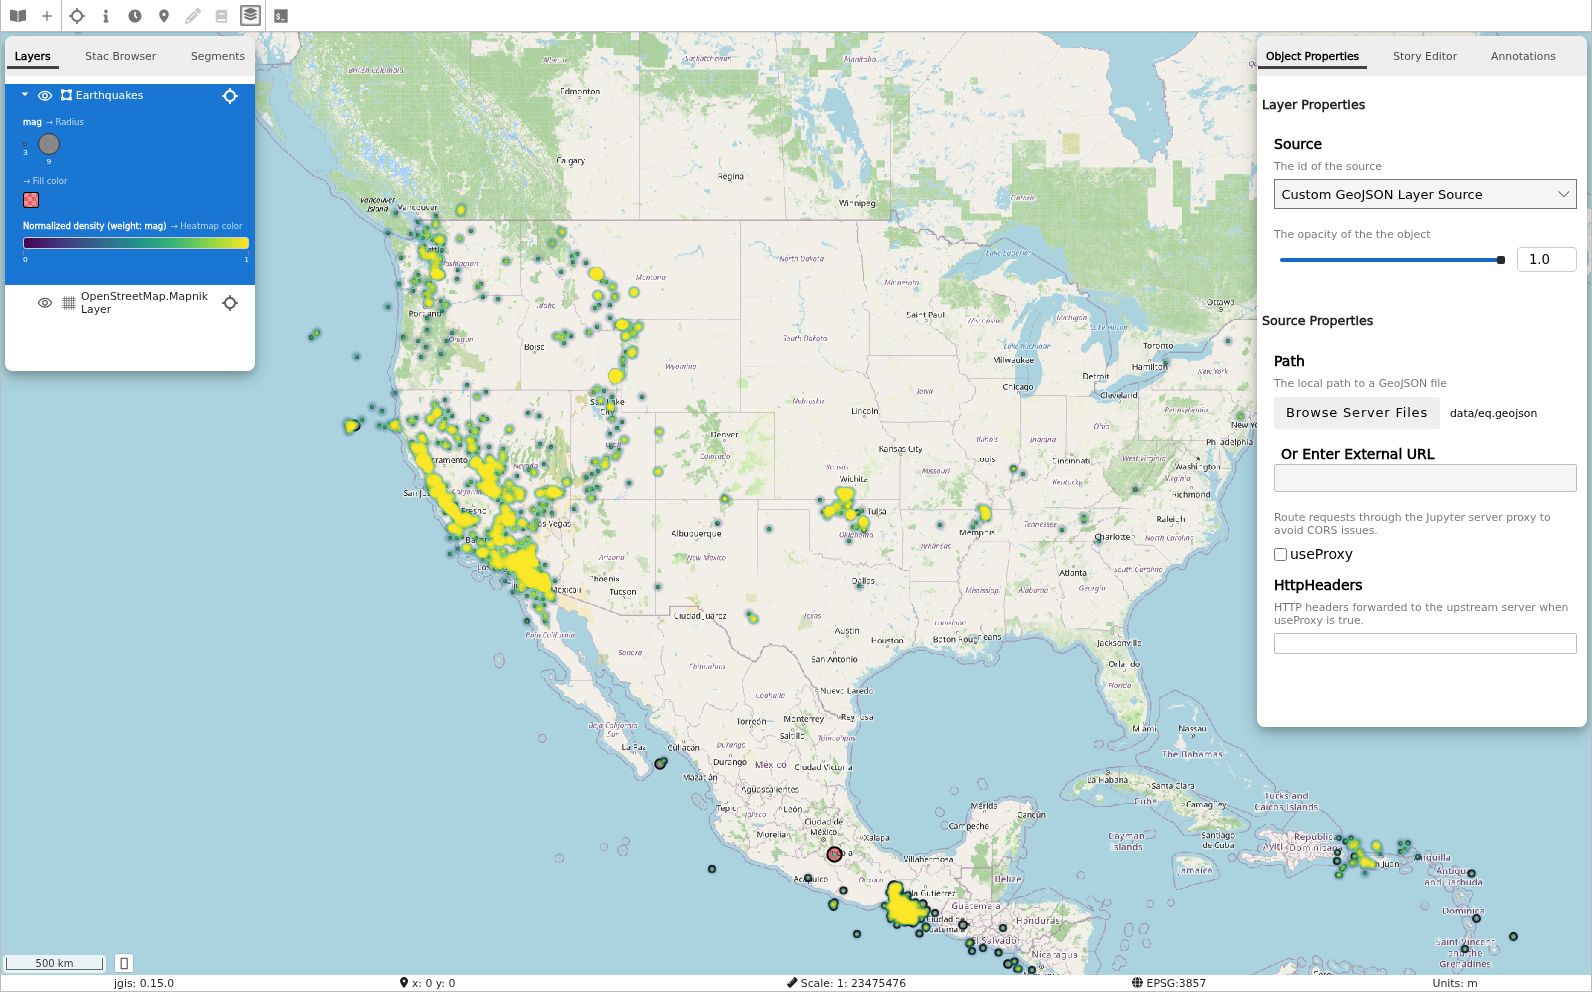
Earthquakes symbology — Earthquake data visualized with a KDE density heatmap and magnitude-scaled graduated circles, demonstrating JupyterGIS symbology features.
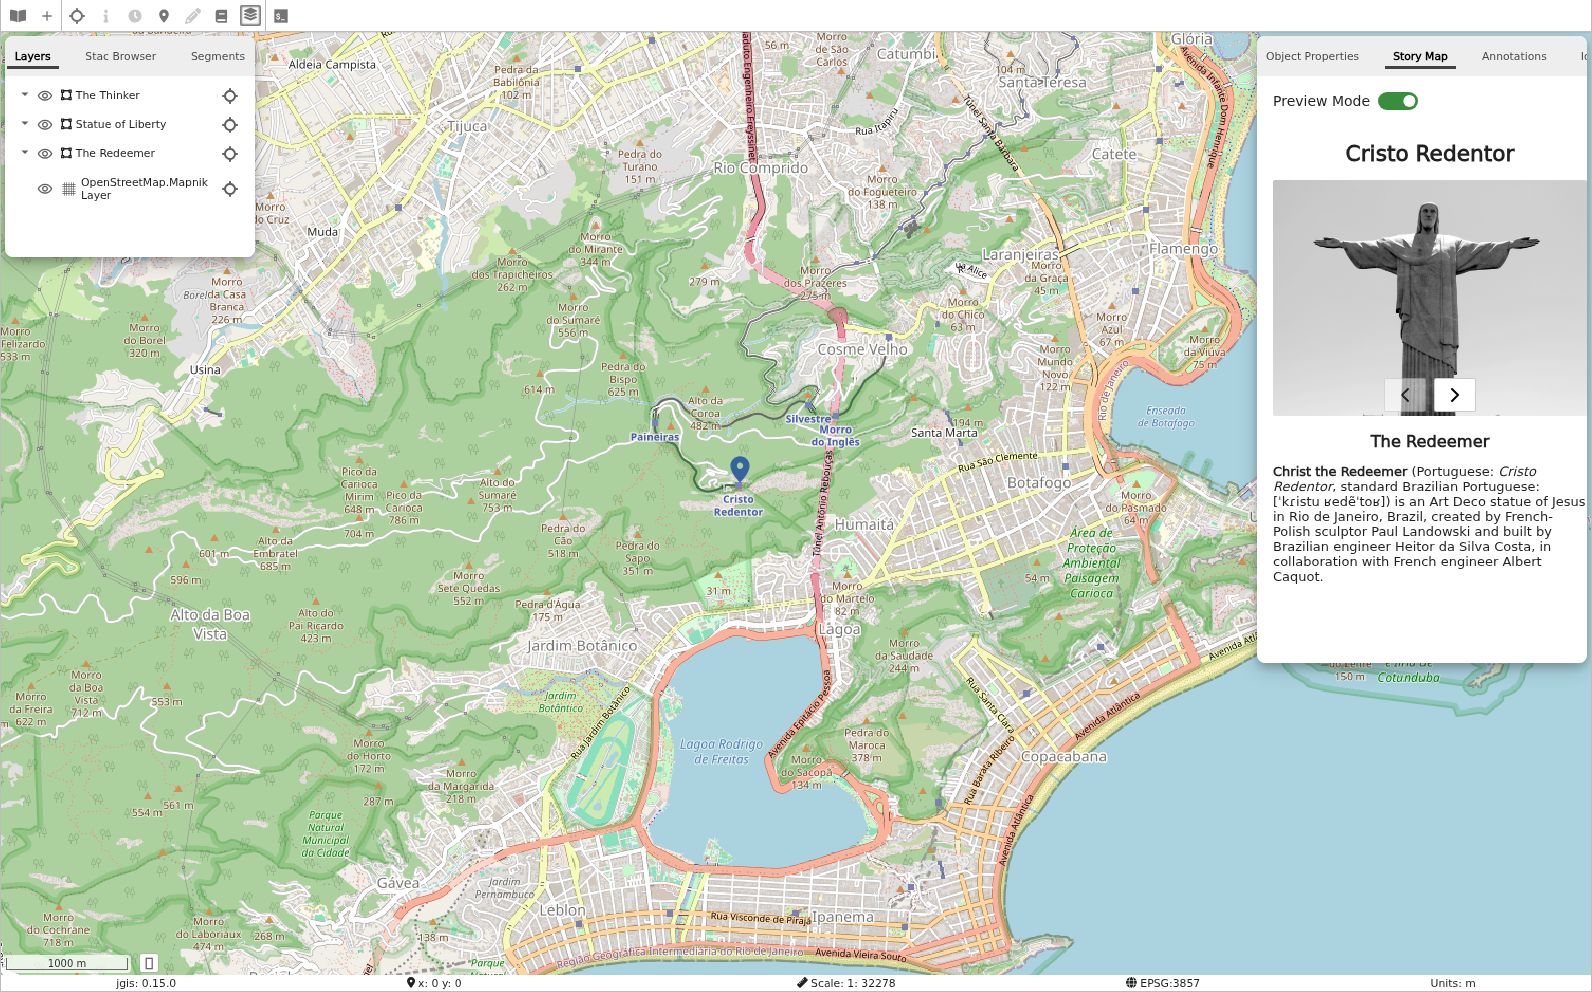
Story map — A guided narrative tour through world landmarks using the story map feature, combining map navigation with rich text and imagery.
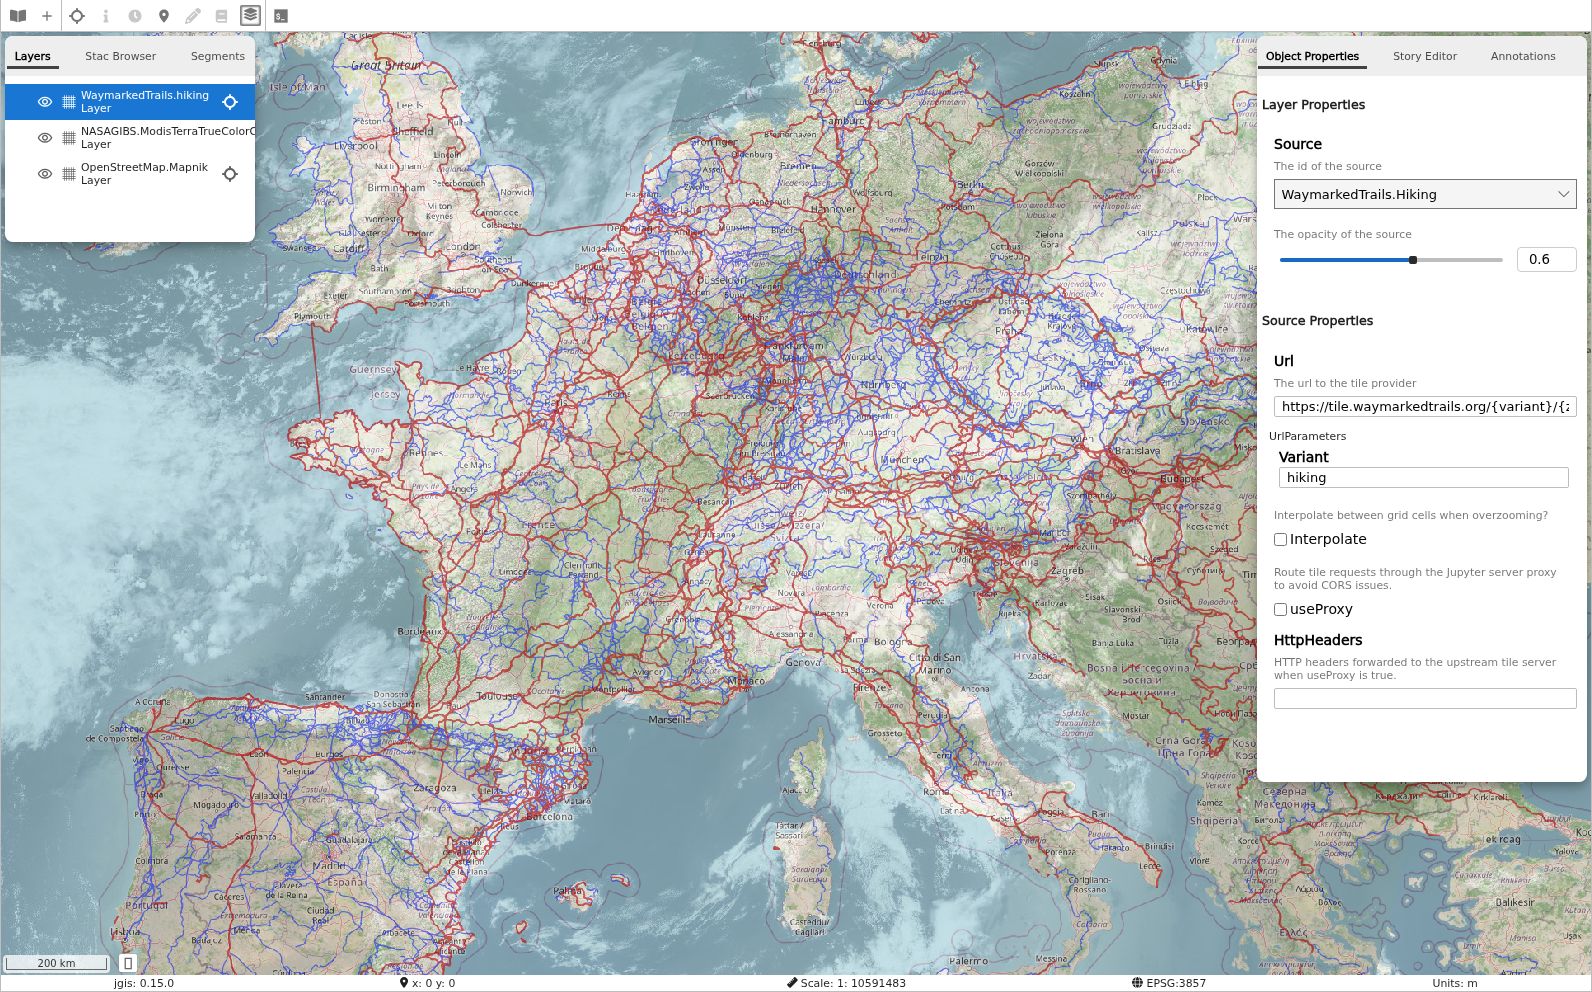
France hiking layers — Multi-layer raster composition combining OpenStreetMap, WaymarkedTrails hiking overlays, and NASA satellite imagery over France.
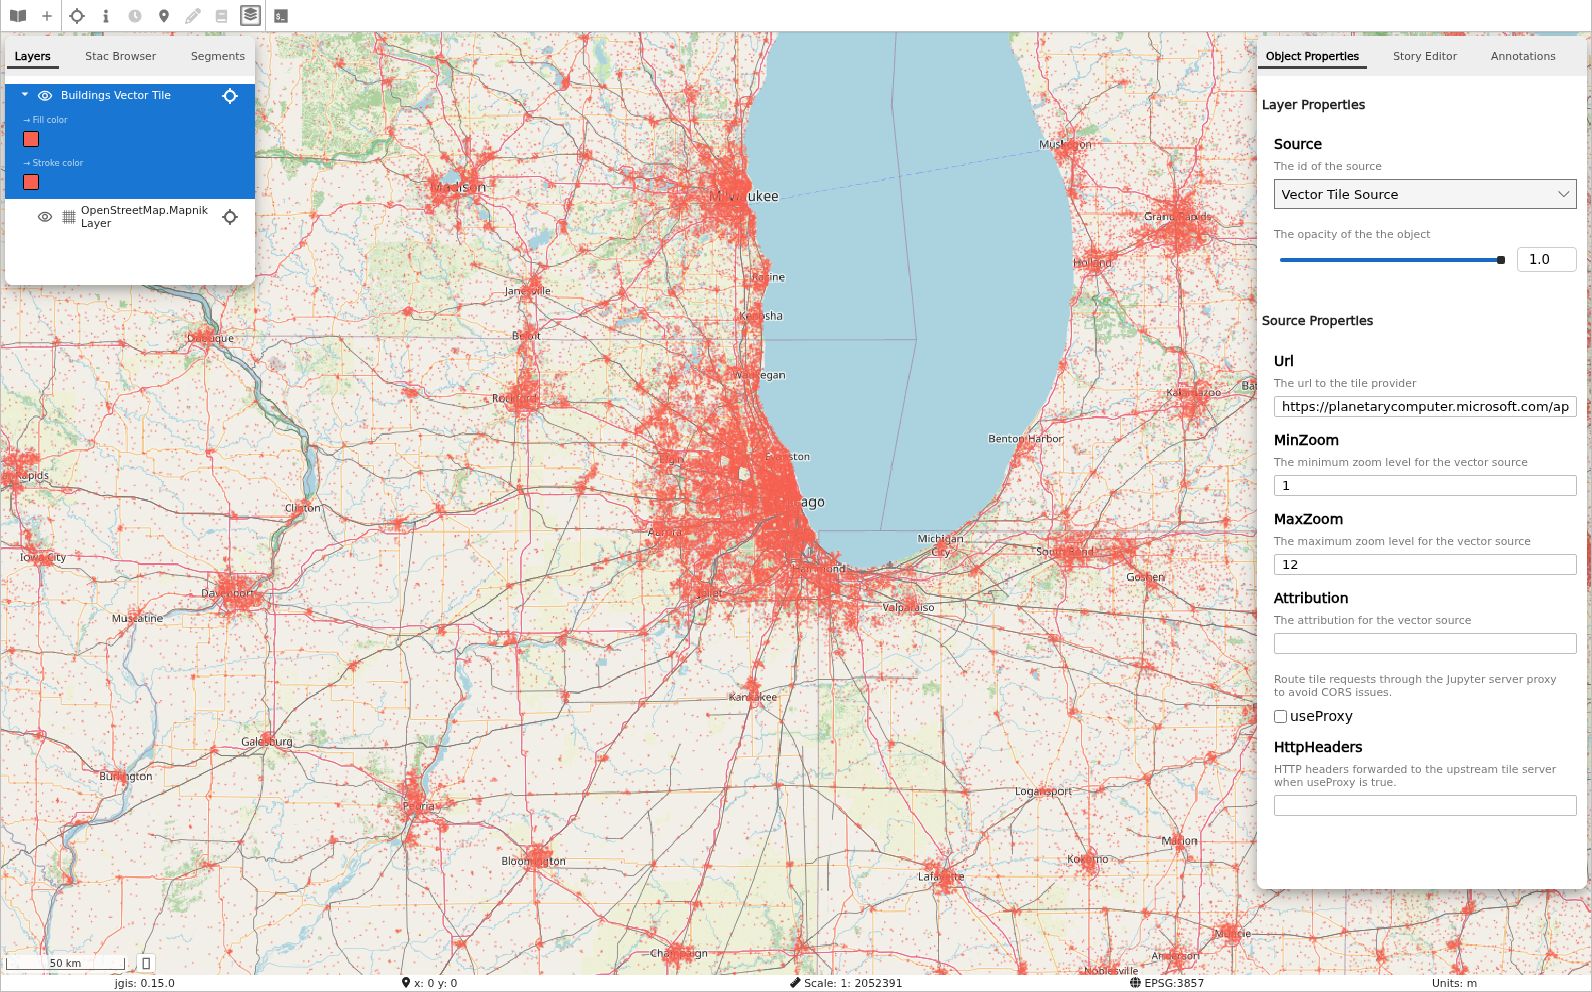
Buildings vector tiles — Building footprints from Microsoft’s Planetary Computer displayed as vector tiles with color mapping over Chicago.